
Are Waitlists at Top-Tier Colleges Worthwhile?
Last year, we posted a piece that advised students on things they could do to demonstrate their continued interest in a top-tier college that had offered them waitlist status instead of admission. However, the actions that we recommended would place additional demands on a student’s time during the busiest part of their admissions campaign, and the impact produced would be marginal. So the question arises… is being waitlisted worth your effort, even in the case of your dream school?
The best way to handicap your odds of ultimate acceptance from a waitlist is to review the history of that school regarding waitlisted applicants. Schools usually follow a steady pattern year after year, although flip-flops occasionally occur when an admissions office has erred significantly in the forecast of its yield rate (the percentage of admitted students who will accept the offer and matriculate in the fall). However, since students can’t predict the pending yield status of a school while they’re waitlisted, history is the only guide.
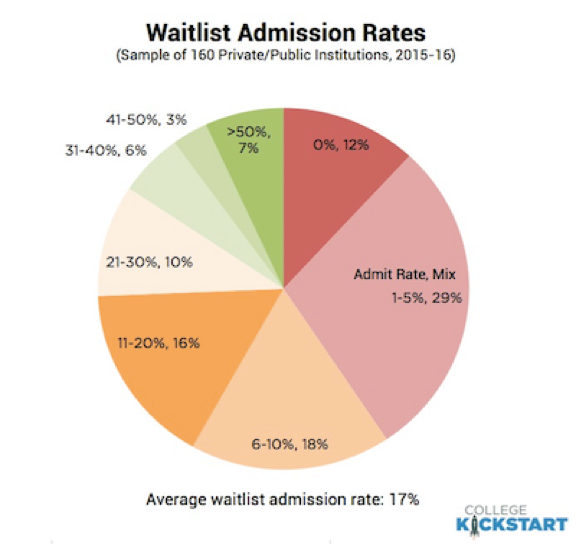
The graphic below is an overview of the odds of being admitted from a waitlist:

This sample of waitlist statistics from 160 private and public institutions yielded the following key metrics, which are not particularly encouraging:
- On average, 17% of students accepting a place on a waitlist were admitted.
- 58% of schools admitted 10% or less of students on their waitlist last year.
- 41% of the schools admitted 5% or less from their waitlist.
- 12% of schools did not admit any students from their waitlist.
Let’s review a few Ivy League and other top-tier institution’s waitlist programs to see how waitlisted students have fared lately. Stanford, the most selective university in the U.S., admitted only seven from its waitlist in 2014 and none from a list of 927 in 2015. No waitlisted students were admitted at Bryn Mawr, Dickinson, Lehigh, and Tulane colleges. They had little success at Carnegie Mellon (four) and Duke (nine).
The University of Michigan’s waitlist invitations grew extraordinarily high last year because its application volume had recently spiked. Surging volume increased uncertainty and the University’s yield rate was expected to fluctuate. About 4,500 students accepted spots on Michigan’s waitlist — the equivalent of 75% of the school’s freshman class size. However, their forecasted yield rate proved fairly accurate and they admitted only 2% of the students on their waitlist.
Harvard uses waitlists but reveals nothing about them. Yale disclosed that it invited 1,324 applicants to its list in 2014, about the same size as its entering class, but declined to reveal how many were admitted.
Case Western Reserve University assesses admissions at higher-ranked private schools such as Northwestern, Chicago, Carnegie Mellon, and Emory. Those schools have, in the past, drawn admitted students away from Case Western. To ensure that the University achieves its freshman class goal of 1,250 students, Case Western keeps a large waitlist and uses it aggressively. The school invited more than 9,000 applicants to its wait list in 2015 and 5,119 of them accepted. The University offered admission to 518 of those students. Not all accepted, but the school met its enrollment goal through its waitlist management process.
The Table below shows the waitlist results for selected institutions, including many of the most selective colleges and universities in the U.S., for the 2015-2016 admissions year. Some top-tier schools are missing because they either don’t maintain a waitlist or they don’t report results. Some institutions report some results but not others, as indicated by “n/a”.Bottom of Form
Table: Waitlist Results for Selected Institutions for 2015-2106
| Institution | Waitlist Offers | Waitlist Size | Waitlist Admits |
Class Size |
| Amherst | 1,398 | 643 | 33 | 477 |
| Barnard | 1,195 | 130 | 6 | 635 |
| Bates | 1,535 | 671 | 11 | 517 |
| Brandeis | 1,553 | 595 | 25 | 802 |
| Brown | n/a | n/a | 192 | 1,615 |
| Bryn Mawr | 872 | 427 | 0 | 385 |
| Bucknell | 2,427 | 922 | 59 | 938 |
| Caltech | n/a | n/a | n/a | 241 |
| Carleton | 1,350 | 442 | 16 | 491 |
| Carnegie Mellon | 5,526 | 2,835 | 4 | 1,575 |
| Case Western Reserve | 9,446 | 5,119 | 518 | 1,259 |
| Centre | 183 | 42 | 19 | 379 |
| Claremont McKenna | 919 | 453 | 75 | 343 |
| Colgate | 1,896 | 913 | 49 | 773 |
| College of the Holy Cross | 1,307 | 494 | 8 | 738 |
| Colorado College | 1,119 | 232 | 24 | 583 |
| Connecticut College | 1,306 | 637 | 61 | 482 |
| Cornell University | 3,583 | 2,231 | 81 | 3,180 |
| Dartmouth | 1,852 | 963 | 129 | 1,116 |
| Dickinson | 848 | 261 | 0 | 731 |
| Duke | n/a | n/a | 9 | 1,745 |
| Emory | 3,809 | 1,910 | 45 | 1,357 |
| Furman | 208 | 51 | 14 | 672 |
| George Washington | 3,827 | 1,354 | 62 | 2,589 |
| Georgia Tech | 3,397 | 2,031 | 38 | 3,089 |
| Gettysburg | 768 | n/a | n/a | 699 |
| Grinnell | 1,224 | 474 | 18 | 442 |
| Hamilton | 958 | 365 | 47 | 473 |
| Harvey Mudd | 534 | 354 | 11 | 214 |
| Haverford | 883 | 354 | 12 | 346 |
| Johns Hopkins | 2,752 | 1,747 | 187 | 1,299 |
| Kenyon | 2,876 | 998 | 17 | 492 |
| Lafayette | 1,532 | 428 | 3 | 672 |
| Lehigh | 4,232 | 1,847 | 0 | 1,261 |
| Macalester | 350 | 177 | 0 | 583 |
| Middlebury | 1,304 | 530 | 33 | 589 |
| Mount Holyoke | 785 | 459 | 7 | 532 |
| Northwestern | 2,614 | 1,452 | 43 | 2,018 |
| Oberlin | 1,126 | 459 | 86 | 778 |
| Occidental | 705 | 359 | 26 | 517 |
| Ohio State | 1,556 | 304 | 304 | 7,023 |
| Penn State | 1,473 | 1,473 | 1,445 | 7,626 |
| Pitzer | 1,021 | 895 | 23 | 267 |
| Pomona | 842 | 492 | 38 | 400 |
| Princeton | 1,206 | 857 | 39 | 1,319 |
| Purdue | 1,728 | 1,713 | 643 | 6,812 |
| Rensselaer Polytechnic | 4,087 | 2,203 | 57 | 1,379 |
| Rhodes | 1,290 | 277 | 45 | 562 |
| Rice | 2,237 | 1,659 | 127 | 969 |
| Sewanee | 1,039 | 202 | 21 | 469 |
| Skidmore | 1,742 | 378 | 13 | 686 |
| Smith | 773 | 398 | 132 | 609 |
| St. Olaf | 729 | 150 | 113 | 763 |
| Stanford | 1,256 | 927 | 0 | 1,720 |
| Tulane | 3,413 | 921 | 0 | 1,719 |
| Union | 1,167 | 626 | 64 | 568 |
| Univ. of Cal. at Berkeley | 3,760 | 2,445 | 1,340 | 5,550 |
| Univ. of California at Davis | 9,033 | 2,733 | 2,030 | 5,369 |
| Univ. of California at Irvine | 7,361 | 4,035 | 131 | 5,756 |
| Univ. of Cal. at Santa Barbara | 5,006 | 2,910 | 278 | 4,459 |
| University of Maryland | 500 | 500 | 0 | 3,937 |
| Univ. of Mass. at Amherst | 5,450 | 1,278 | 26 | 4,661 |
| University of Miami | 5,563 | 1,295 | 73 | 2,080 |
| University of Michigan | 14,960 | 4,512 | 90 | 6,071 |
| Univ. of North Carolina | 3,144 | 1,513 | 78 | 4,076 |
| Univ. of Pennsylvania | 2,474 | 1,438 | 90 | 2,435 |
| University of Richmond | 4,070 | 1,547 | 151 | 807 |
| University of Texas | 1,634 | 1,168 | 362 | 7,743 |
| University of Virginia | 4,547 | 2,081 | 402 | 3,685 |
| Vanderbilt University | n/a | n/a | 188 | 1,607 |
| Washington and Lee | 1,983 | 764 | 193 | 454 |
| Wellesley | 1,404 | 843 | 30 | 595 |
| Wesleyan | 1,877 | 884 | 12 | 787 |
| Whitman | 872 | 370 | 67 | 364 |
| William & Mary | 3,552 | 1,676 | 187 | 1,518 |
| Williams | 1,603 | 573 | 53 | 551 |
| Worcester Polytechnic | 2,472 | 1,373 | 41 | 1,093 |
| Yale | 1,324 | n/a | n/a | n/a |
Source: The Washington Post – Responses to Common Data Set questionnaire by admissions officials
The best thing to do if you’re offered waitlist status by your first choice school is to obtain the advice of your IvySelect college admissions consultant. Together, we will consider acceptance offers that you may have received from the other 12 or 13 schools to which you have applied. Since we’ve already determined that you’d be happy at any one of the schools that you applied to, you may be advised to send a deposit to the most appealing of them by May 1st and to plan on attending that school in the fall. Then, if you’re admitted to your dream school from its waitlist, we can consider your options again at that point. Using this approach, you’ll cover all bases and have no regrets come fall.
